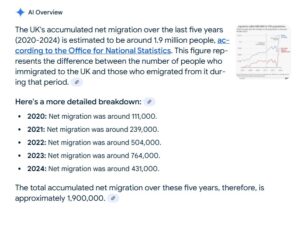
The economic case for the need for immigration is hotly contested. The Migration Observatory at the University of Oxford has examined a lot of these studies. Here is what it concluded:

What number lies between minus one and plus one?? It’s zero. That’s more or less the economic benefit of mass immigration. How much was this mass immigration?
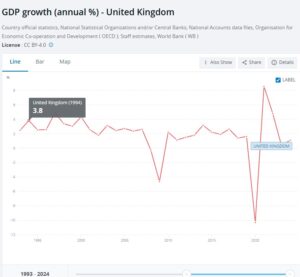
Let us now look at the growth figure in some more detail. Here is annual growth. There is a big dip for Covid and a big spike for an upturn in immigration. Notice how the spike disappears as quickly as it arrived. The ‘growth effects of immigration are just temporary, and leave us with a bigger population to support
That was the nation’s Gross Domestic Product. Let’s divide that by the numbers living here to see how this may have benefited the individual. Here then are the GDP per Capita figures .
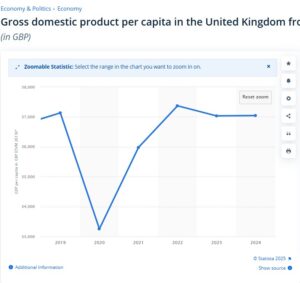
We’re not any better off than we were in 2018. Years of mass immigration and 2 million more people gave you what?
These are the studies Migration Observatory at the University of Oxford looked at. As can be seen there is a clear division between the economic effects of immigrants from outside Europe (Non-EEA) compared to those from Europe (EEA) itself. In general European immigrants are a net gain to the economy and non-Europeans are a net cost. High wage earners make a contribution. Low skilled care workers, baristas, waiters and those on minimum wage do not.
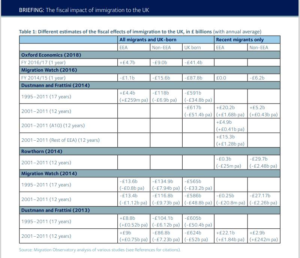
The independent Office for Budget Responsibility has also dipped its toes into the water. The line in yellow shows that low wage immigrants are a net cost from their arrival as adults.
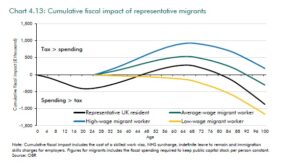
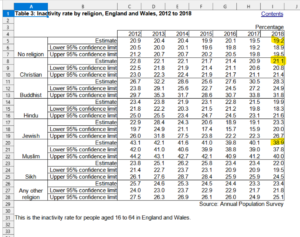
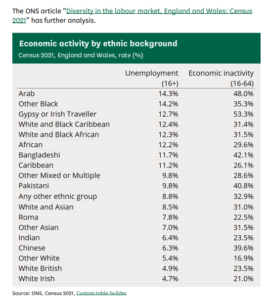
So who are these people with low incomes? The Office for National Statistics has the answer. It is people who are not working and not economically active. The people the ONS describes as “White” seem to be more likely to be in employment, and to be the most economically active.
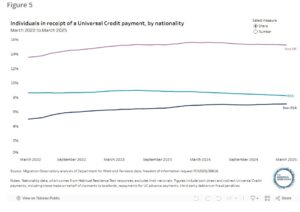
Now let’s take a look at the Unemployed and those claiming Universal Credit. Around one immigrant in seven is claiming Universal Benefit. That’s about one million people, and those are just the figures for the main claimant and doesn’t include dependents.
Source – Migrants in the UK labour market: an overview – Migration Observatory – The Migration Observatory
I stumbled upon this small chart from the Annual Population Survey recently. I don’t have an account there, so can’t access more up to date information. It seems that there is even a religious divide in economic inactivity. It’s estimate is 38% for Muslims and 19% and 21% for atheists and Christians respectively.