Who Do We Hate The Most?
This report is based on a survey designed by the authors with support from YouGov. It was conducted by YouGov between 20th and 21st July 2021 using an online interview with members of YouGov’s participant panel, comprising over 185,000 individuals. Panellists were contacted at random by email based on sample criteria, which were designed to gather data on a representative sample of the adult population of Britain. In total, 1667 people completed the survey. Prior to analysis, the sample was weighted by age, political measures, gender, social grade, region and level of education to ensure representativeness, with the census, Labour Force Survey, Office for National Statistics estimates, and other large-scale data sources being used to inform target quotas.
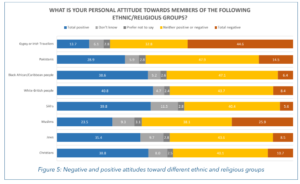
It appears in a university research document on islamophobia and contains some interesting insights, although we’re not exactly told who’s doing the hating. Firstly though let’s see which ethno-religious groups are the most liked in the UK:
Liked the Most
Indigenous Population |
Immigrant Population |
White British40.8% see these positively |
Sikhs39.8% see these positively |
Christians38.8% see these positively |
Black People38.6% see these positively |
Gypsies/Travellers13.7% see these positively |
Jews35.4% see these positively |
|
|
Pakistanis28.9% see these positively |
Muslims23.5% see these positively |
Disliked the Most
Native Population |
Immigrant Population |
Gypsies and Irish Travellers44.6% of people view these negatively |
Muslims25.9” of people view these negatively |
Christians10.7% of people view these negatively |
Pakistanis14.5% of people view these negatively |
White British People8.4% of people view these negatively |
Jews8.5% of people view these negatively |
Black6.4% of people view these negatively |
|
Sikhs5.6% of people view these negatively |
Gypsies weigh in as the least liked and most disliked, Muslims come second, but have their own word, Islamophobia, to compensate. Pakistanis come third in the unpopularity table.
Most liked and least disliked are the White British, followed by Sikhs, Blacks, Jews and Christians